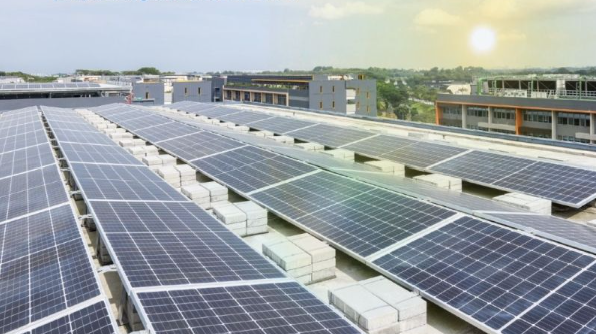
Image source: obtained from publicly available online sources.
PROJECT OVERVIEW
Energy & Water Sources
Energy and water management at Woodlands Hospital reflects the successful translation of sustainable design intent into operational performance. Through passive-first planning, high-efficiency cooling systems, renewable energy and alternative water sources, the campus optimises resource use while supporting resilient healthcare operations.
Energy Performance & Conservation Strategy
Woodlands Health adopts a holistic, passive-first energy strategy that prioritises demand reduction through climate-responsive design, followed by high-efficiency building systems, heat recovery technologies, renewable energy generation, and intelligent building services. As a large integrated healthcare campus operating continuously under stringent indoor environmental requirements, energy performance is achieved through both demand reduction and system optimisation, with outcomes verified through post-occupancy audits and operational performance data.
High-Efficiency Cooling Infrastructure
Cooling systems account for the largest proportion of energy consumption in hospitals due to continuous operation, high occupancy levels, medical equipment loads and ventilation requirements.
To address this demand, Woodlands Hospital utilises a centralised water-cooled chilled water system with:
- Chiller plant efficiency of approximately 0.460 kW/RT
- Overall air-conditioning system efficiency of approximately 0.567 kW/RT
- Cooling capacity of approximately 10,000 RT
The centralised plant serves the Acute Hospital, Community Hospital, Specialist Outpatient Clinics and Long-Term Care facilities.
Compared with conventional decentralised cooling systems, a centralised chilled-water plant achieves higher operational efficiency through economies of scale, reduced equipment redundancy, centralised maintenance and continuous performance optimisation. This allows the campus to maintain thermal comfort and healthcare ventilation requirements while reducing electricity consumption.
Why It Matters
Hospitals operate continuously throughout the year and require dependable cooling for:
- Patient wards
- Operating theatres
- Diagnostic imaging rooms
- Laboratories
- Pharmacy clean rooms
- Public circulation spaces
By improving chiller efficiency, the campus reduces one of its largest energy loads while maintaining critical medical operations.
Energy Audit: Plant Operating Condition
| Audit item | Audit value | Best practice | Interpretation / action |
|---|---|---|---|
| Cooling tower approach | 2.75°C | ≤ 2.0°C | Above best practice; review fan-speed setpoint and clean condenser tubes |
| CHW pump efficiency | 0.0484 kW/RT | ≤ 0.030 kW/RT | Above best practice; review system pressure and minimum-flow condition, then rebalance |
| CW pump efficiency | 0.0494 kW/RT | ≤ 0.035 kW/RT | Above best practice; adopt demand-responsive pump-speed control |
| Cooling tower efficiency | 0.0134 kW/RT | ≤ 0.030 kW/RT | Within best practice; no action required |
Source: Woodlands Hospital OSE Energy Audit Report (22 May 2025), Appendix A, Table 13: Checklist of Plant Operating Condition (for best practices).
Compliance does not equate to optimisation. While the overall cooling plant met the applicable OSE limit during the audit period, the audit identified further improvement opportunities in plant controls and part-load operation.
Energy Strategy Integration
A key strength of Woodlands Hospital is that its energy performance is achieved through multiple complementary systems working together.
| Strategy | Contribution |
|---|---|
| High-efficiency chilled-water plant | Reduces cooling energy demand |
| Heat recovery system | Reuses waste energy |
| Solar PV generation | Produces renewable electricity |
| Low-E façade and glazing | Reduces solar heat gain |
| LED lighting | Lowers electrical demand |
| Occupancy sensors | Reduces energy wastage |
| Natural ventilation | Minimises cooling requirements |
| Building Management System | Optimises operational efficiency |
Rather than relying on a single technology, the campus achieves energy performance through a combination of active and passive design measures.
Overall Energy Performance
The integrated energy strategy at Woodlands Hospital demonstrates how a large healthcare development can reduce energy demand while maintaining the stringent environmental requirements necessary for patient care.
Collectively, the cooling infrastructure, heat recovery systems, solar PV generation, passive design measures and smart building controls contribute to:
- Approximately 33.4% reduction in building energy consumption
- Approximately 33.68 million kWh of annual energy savings
- Approximately 16,839 tonnes of avoided CO₂ emissions annually
These outcomes illustrate that energy efficiency at Woodlands Hospital is not achieved through a single technology but through a coordinated approach encompassing architectural design, engineering systems, renewable energy integration and operational management.
Together, these initiatives contribute to an estimated 33.4% reduction in building energy consumption, equivalent to approximately 33.68 million kWh of annual energy savings and 16,839 tonnes of CO₂ emissions avoided annually.
Water efficiency
Landscape doing the work of infrastructure
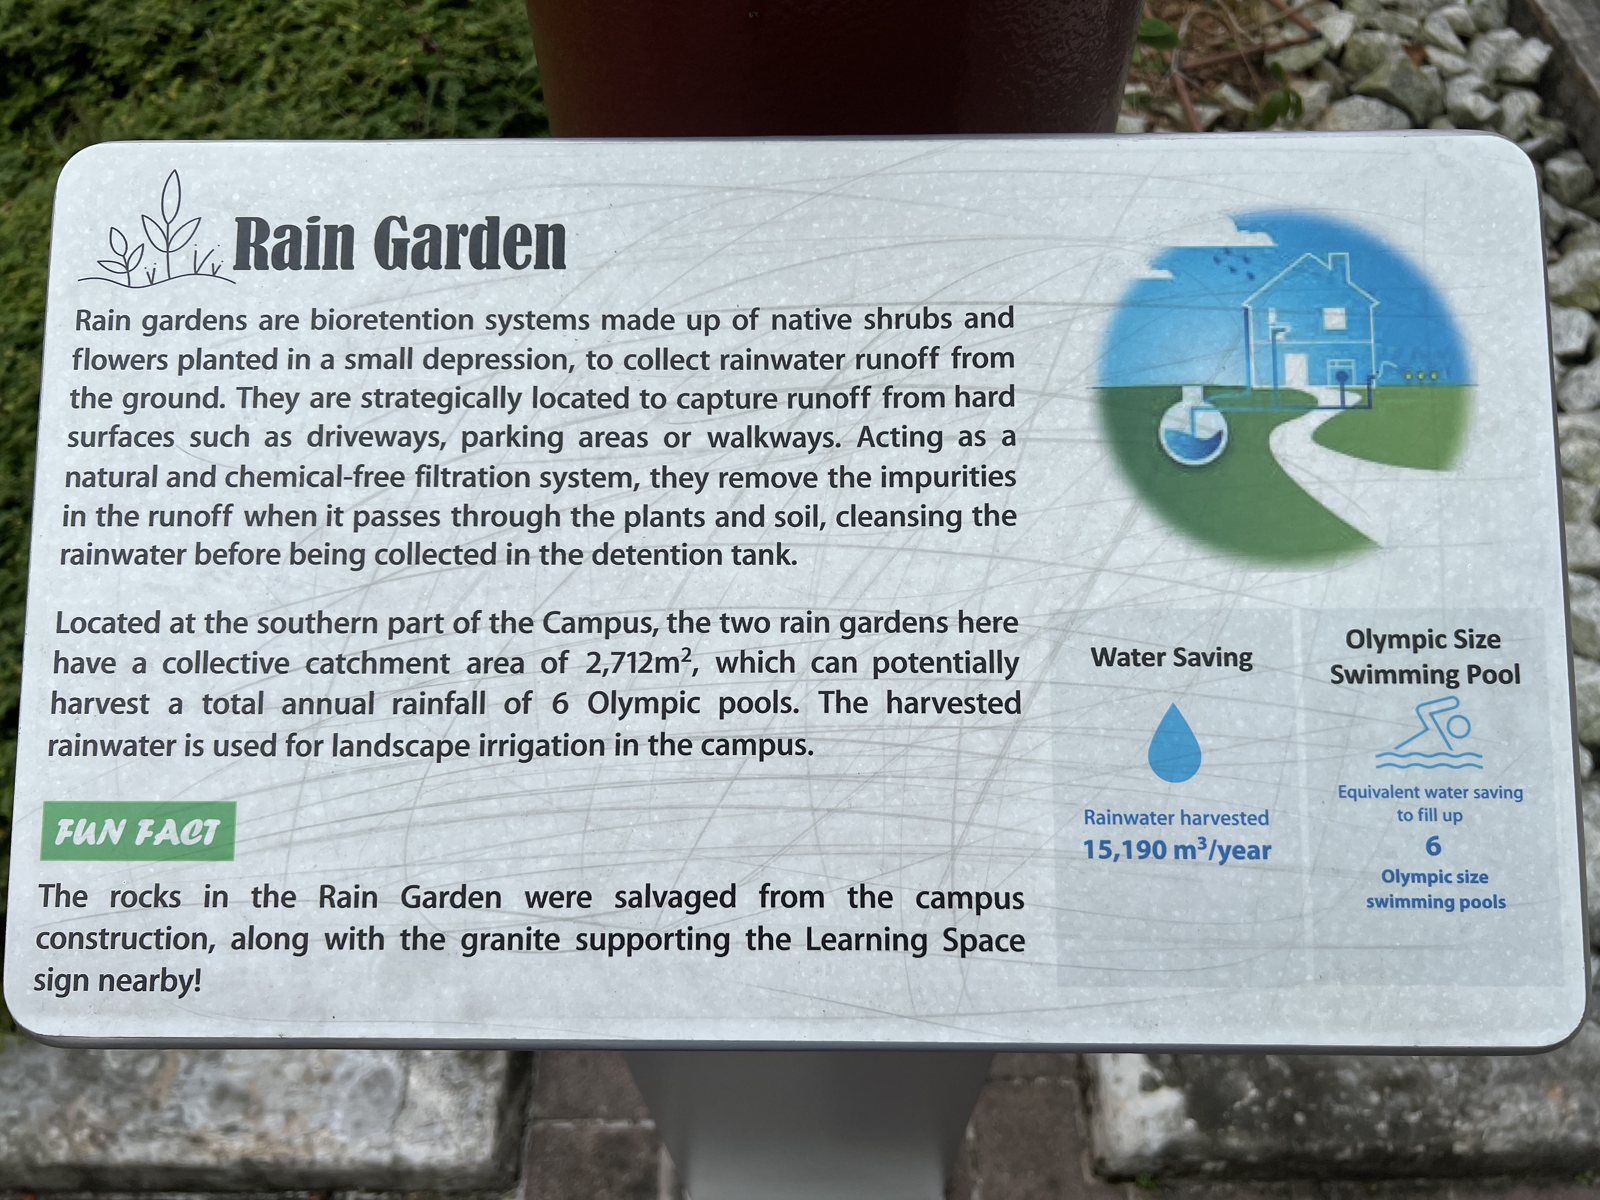
A campus of 7.66 hectares planned as a park needs a lot of water that never has to be drinkable. Woodlands covers part of that need by making its own planting into a stormwater system. It collects well. What limits it is the clock. Each storm has to leave the detention tank within four hours, and a garden cannot drink that fast (PUB, 2021).
projected campus harvest, about six Olympic pools
two year operating record
share rainwater was meant to supply
kitchen waste turned into water, none of it reused
The projection is publishedpublished. The three operating figures were stated at the staff briefing of 28 August 2026site visit. The Vibrant Campus Handbook puts the irrigation share at 87%, while the briefing gave 80%; the lower figure is used here.
Where the water goes
Roofs and paved surfaces drain through a siphonic system, the green marked grates you see on the ground. The campus display board describes it as a way of avoiding deep concrete drains, and the briefing added that it moves water away faster. Road and landscape runoff takes the other route, into two rain retention systems where it passes through stone graded coarse to fine and then a filter layer. Everything meets in a combined retention and detention tank. From there water is transferred to a separate irrigation tank, which is what feeds the drip lines.site visit
Worth holding on to before the rest of this section. The rainwater projection of 15,190 m³ a year is about 6% of the 261,652 m³ annual water saving the project submitted to BCA. Efficient fittings and NEWater carry most of the rest. The part of the system with interpretive signs in front of it is the smallest part of it.published
Six things designed, six things delivered
| Designed | Delivered | Why | |
|---|---|---|---|
| Rainwater harvest | About six Olympic pools a year across the campus | About 2.4 pools | Detention volume has to be free again four hours after a storm |
| Irrigation supply | Rainwater to cover most of the irrigation demand | Below target, topped up with NEWater | Follows directly from the harvest shortfall |
| Canopy rainwater | Rain channelled off the canopy into the landscape | Fell directly and splashed; extended and rectified, some areas still wet | Setting out at installation |
| Food waste to water | About 500 tonnes a year turned into liquid fertiliser and grey water for washing | Around 365 tonnes a year, and the water goes to the sewer | Did not pass the required water tests |
| Rain sensors | Automatic irrigation with a rain sensor over at least half the landscape | Not installed | The point was claimed at as-built certification in 2023, three years before the visit |
| Sub-metering | Private meters on irrigation and cooling tower, linked to the BMS for leak detection | No points claimed at as-built certification | Which is why the harvest figure has no meter behind it |
Designed column from the campus display board and the Green Mark submissionspublished. Delivered column stated at the staff briefingsite visit. One further gap sits outside the table: the 2020 project write up states that more than 80% of the planting is native and low water consuming, while the as-built submission claims no point for drought tolerant planting over 80% of the landscape. The digester serves a campus wide vacuum waste network. The water was recovered successfully and then could not be used, so the benefit that remains is diverting food from the general waste stream rather than recovering water.
What happens after a storm
The first row of that table is the one worth watching, because the reason sits in the clock rather than in the hardware. Press play and follow the tank.
Storm. Runoff arrives faster than it can be transferred out.
PUB requires a detention tank to be emptied within four hours of a storm so that the volume is free for the next one, and NEA requires it to be fully drainable so it cannot breed mosquitoes. Combining detention with harvesting is allowed, and Woodlands does it the permitted way, by pumping across into a separate irrigation tank. The catch is the window. Whatever has not been moved and used in four hours goes to the drain.published
So the limit is not a shortage of storage. It is that a storm delivers in an hour what the landscape would take days to drink. Tank volumes and transfer rates were not available to this study.
Holding water for longer is not the aim. Standing water breeds mosquitoes, which is why detention storage must drain fully (PUB, 2021). What decides the harvest is how much can be moved into the covered irrigation tank inside the four hours, and how quickly the planting can use it.
From the site
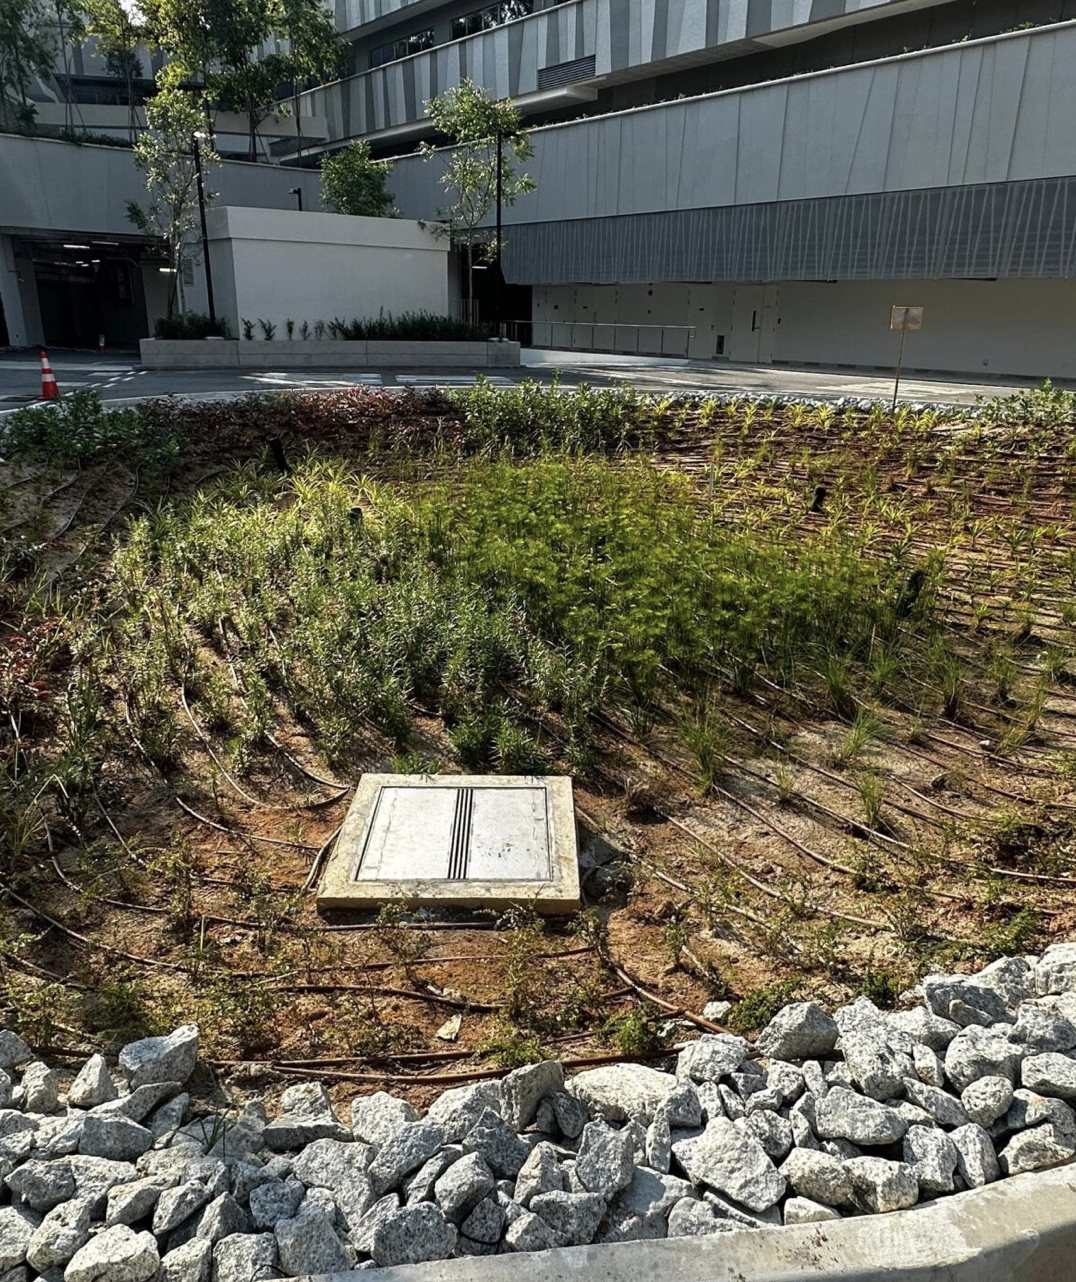
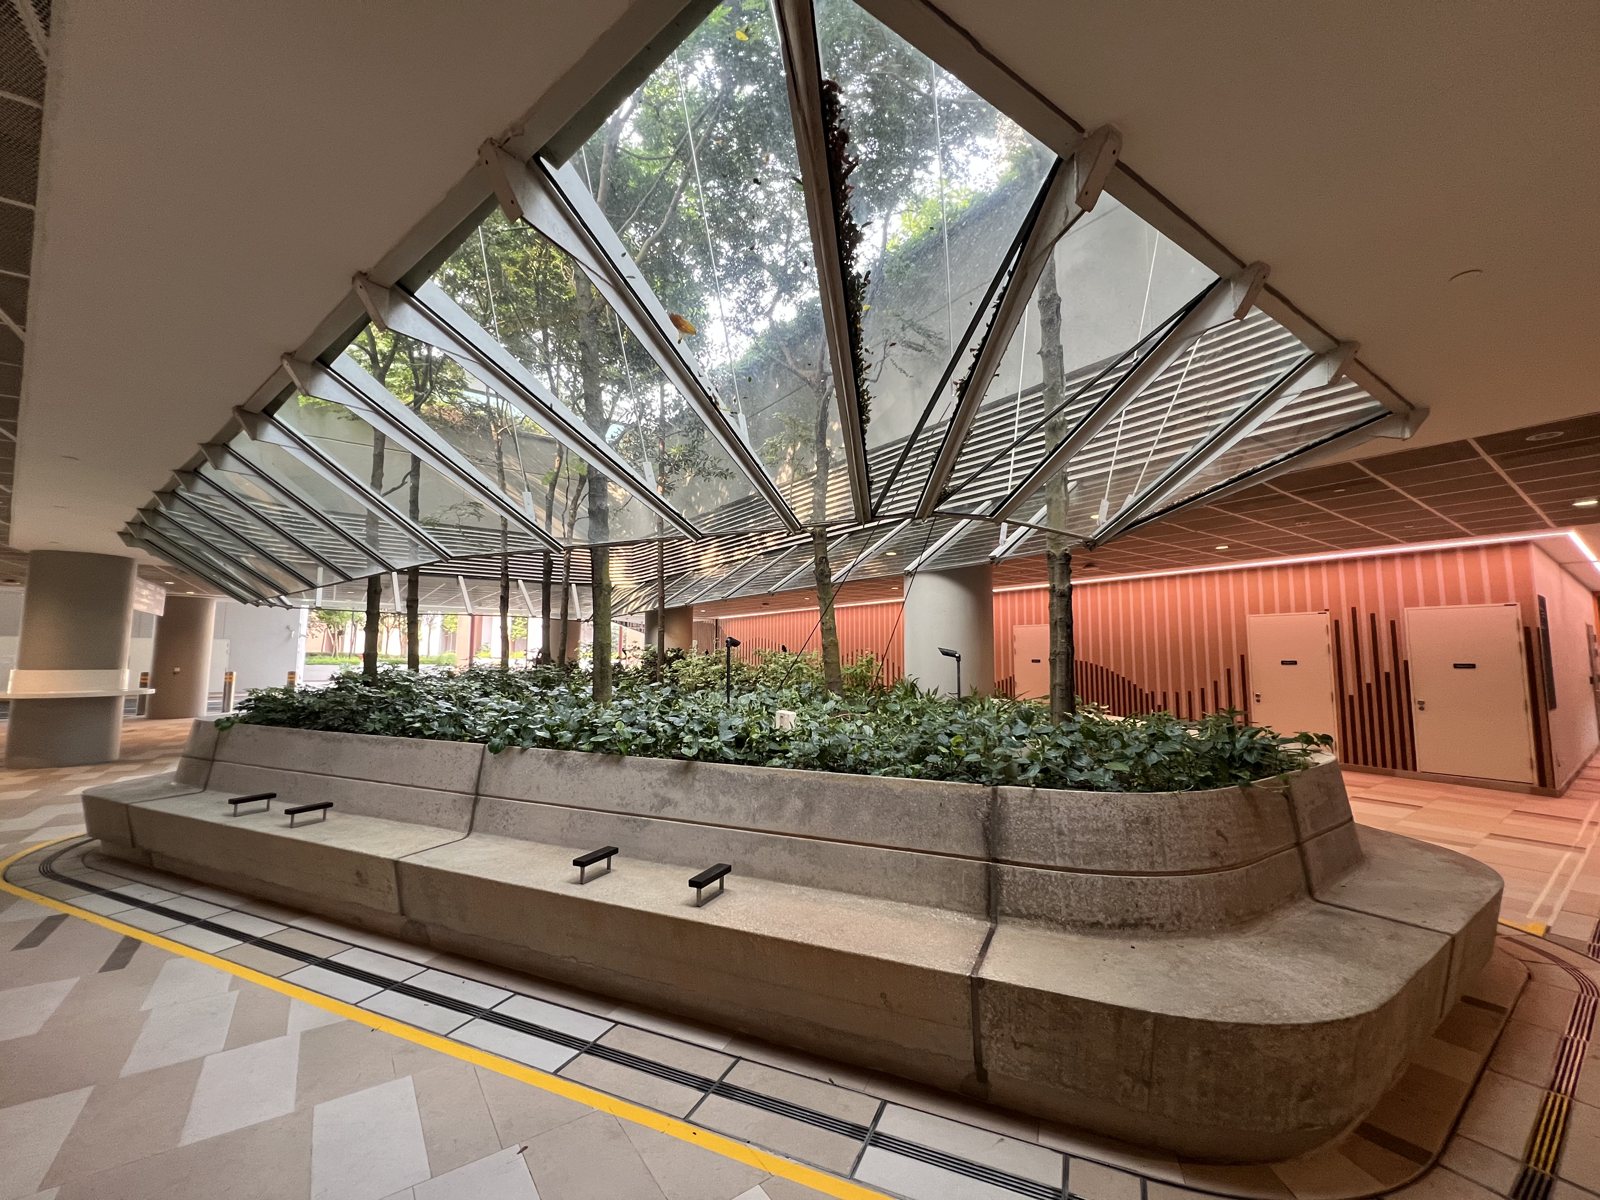
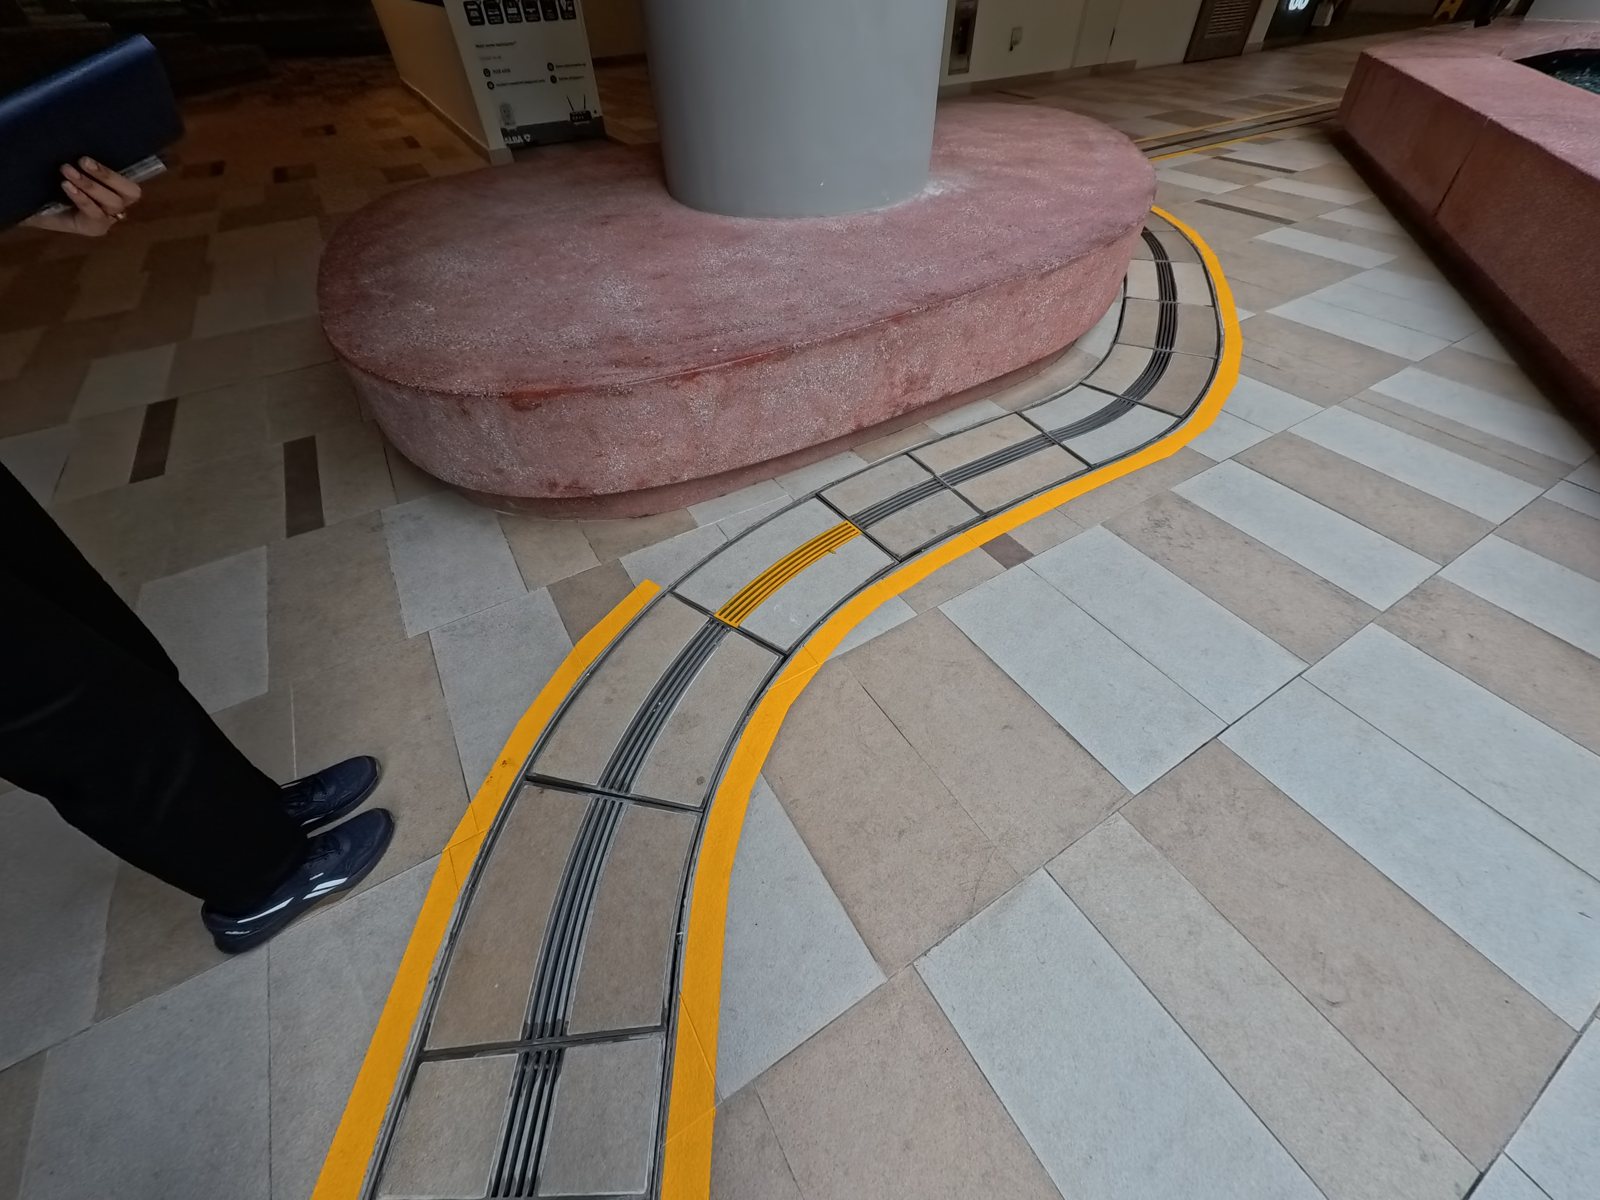
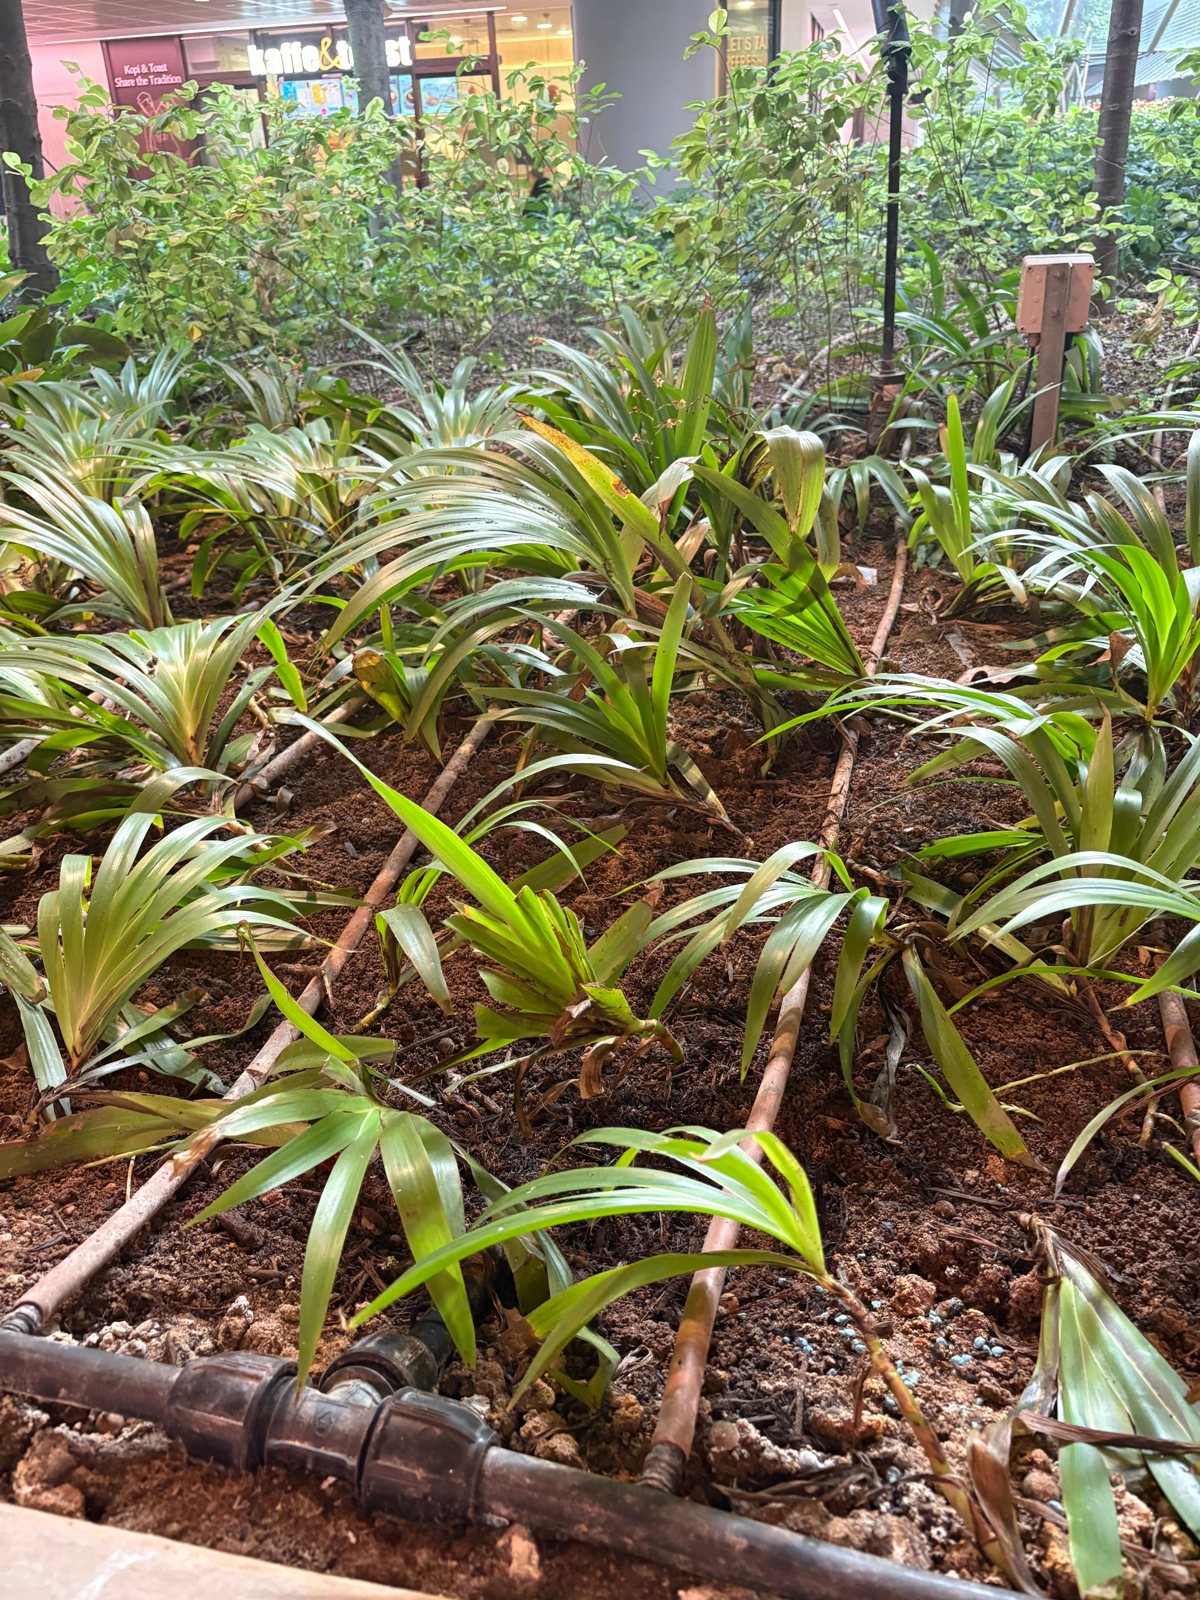
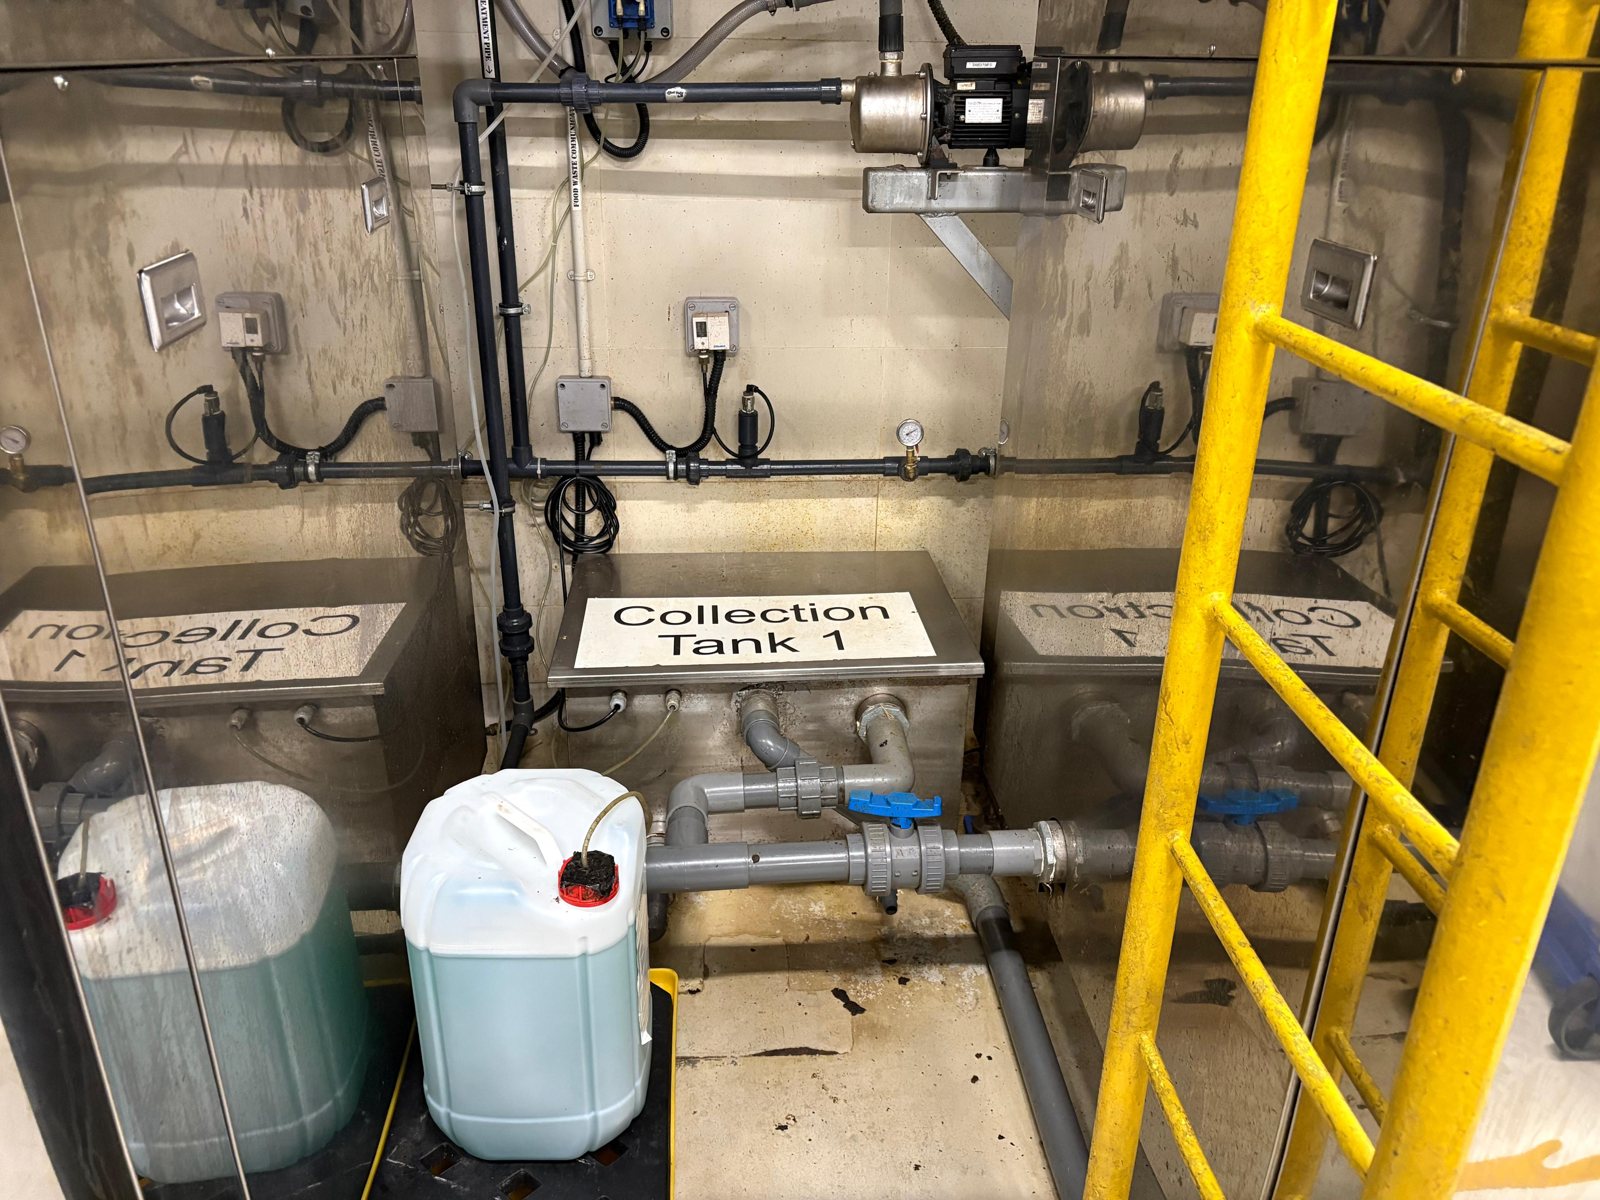
Swipe or drag to see all six
The target it is working to
GreenGov.SG, the public sector's own sustainability programme under the Singapore Green Plan 2030, commits government agencies to improving water efficiency by 10% by 2030 against the average of FY2018 to FY2020, measured as litres used per person per day (MSE, 2021).published Woodlands Hospital only opened in 2024 and has no share in that baseline, so its institutional target was prorated to 6% against a 2024 baseline, and the first year of operation becomes the reference point rather than a historical average.site visit
The other side of the meter
Everything above is about supply. On the demand side the campus works mostly through procurement and equipment choice, and the two biggest published figures sit on a different circuit from the harvested water. Rainwater goes to the irrigation tank, NEWater tops it up and also supplies cooling tower make up, and laundry and floor cleaning draw on the mains.published
rated Excellent under WELS. Another 406 are Very Good and 1,410 carry no rating
washing about 2,900 pieces of linen
saved by robots and a floor scrubber against hosing down
The trade-off
The capture system works as built, and the storage is arranged the way the regulator asks. What no arrangement of tanks can fix is the mismatch between how fast rain arrives and how slowly a garden uses it. Flood safety sets a four hour deadline, and the landscape cannot drink that quickly, so most of a storm leaves. A hospital cannot compromise on the first, which makes this a limit rather than a fault.
The consequence is worth stating plainly. The water the system fails to keep does not simply go unused. It is replaced with NEWater, so the shortfall converts into purchased supply rather than into dry planting.
The same pattern appears in the smaller items. The rain sensors on the graphic were never installed, the canopy edge was set out slightly wrong and needed a second round of rectification, and the siphonic grates depend on someone clearing dry leaves. All of them sit in the layer above the hardware, which is an argument for treating the first operating years as part of the design process rather than as the end of it.
Staff briefing, 28 August 2026. Recorded and transcribed. Six pools projected, 2.4 achieved over two years, and the four hour discharge given as the cause, at 12:20. Rain sensors not installed, at 28:40. The 80% irrigation share and the NEWater top up, at 29:30. Canopy rainwater misalignment and rectification, at 51:30. Two rain retention systems and the graded stone media, at 49:35. Digester capacity at 40:35 and the failed water tests at 41:45. Siphonic drainage and leaf clearing, at 53:34. GreenGov.SG targets and the prorated 6%, at 18:17.
On campus. Active and Sustainable Campus display board, published by Woodlands Health, the source of the siphonic discharge, rainwater collection, rain sensor and food waste captions · Rain Garden information sign · Vibrant Campus and WHeal educational snippet series, the source of the 3-tick fittings, the daily linen figure and the floor scrubbing saving · photographs taken on 28 August 2026.
Restricted, paraphrased only. As-built Green Mark score calculations for the campus, a statutory filing signed on 21 July 2023, which is the source of the fitting counts, the zero score for sub-metering, the rain sensor point and the drought tolerant planting score. No page of it is reproduced here.
Not established. Tank volumes and the transfer rate between detention and irrigation storage · how many rain gardens the campus has and their total catchment · how the 2.4 pool figure was derived or metered · the volume of NEWater used to top up irrigation · catchment zoning and pipe routing · rainwater quality results, which the hospital indicated would have to come from its facilities team · how the 2.4 pool figure was arrived at, given that the irrigation line carries no private meter · total campus water consumption, and how the harvested share compares with it. None of these has been estimated or inferred.